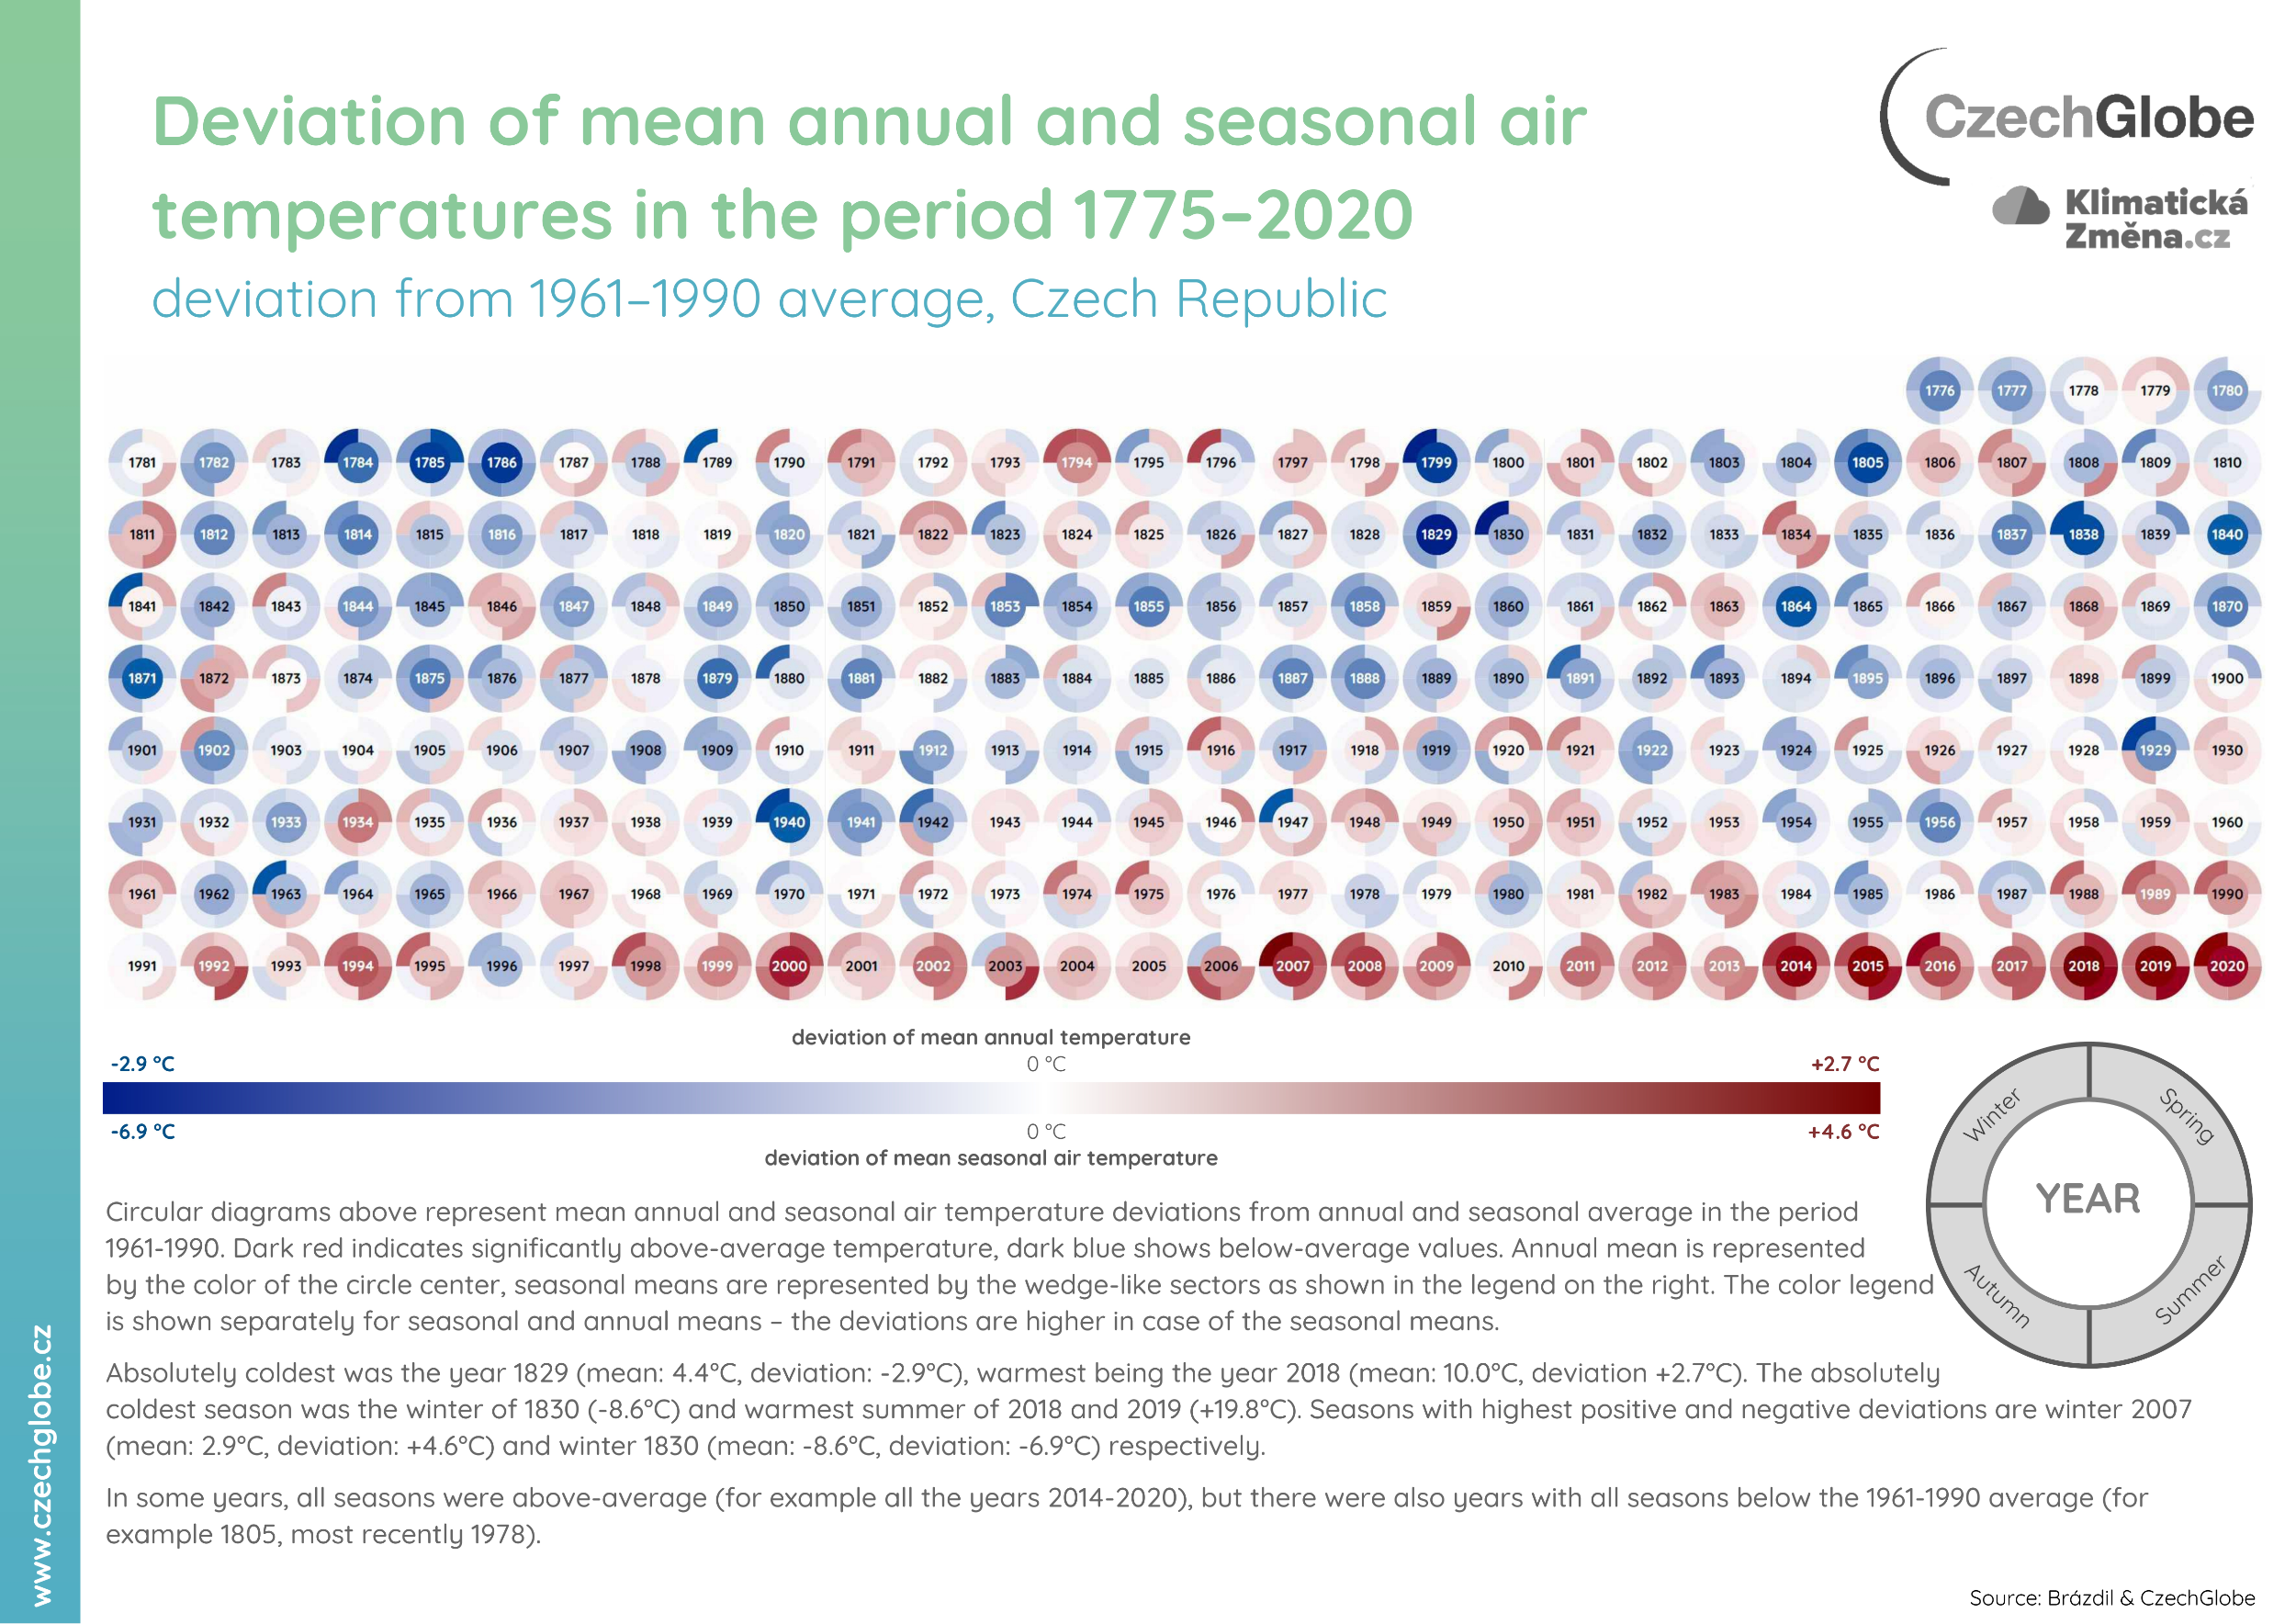
Deviation of mean annual and seasonal air temperatures in the period 1775–2020
Circular diagrams above represent mean annual and seasonal air temperature deviations from annual and seasonal average in the period 1961-1990. Dark red indicates significantly above-average temperature, dark blue shows below-average values. Annual mean is represented by the color of the circle center, seasonal means are represented by the wedge-like sectors as shown in the legend on the right. The color legend is shown separately for seasonal and annual means – the deviations are higher in case of the seasonal means.
Absolutely coldest was the year 1829 (mean: 4.4°C, deviation: -2.9°C), warmest being the year 2018 (mean: 10.0°C, deviation +2.7°C). The absolutely coldest season was the winter of 1830 (-8.6°C) and warmest summer of 2018 and 2019 (+19.8°C). Seasons with highest positive and negative deviations are winter 2007 (mean: 2.9°C, deviation: +4.6°C) and winter 1830 (mean: -8.6°C, deviation: -6.9°C) respectively.
In some years, all seasons were above-average (for example all the years 2014-2020), but there were also years with all seasons below the 1961-1990 average (for example 1805, most recently 1978).